Posts

Lebanon: An Increase in Taxes on Electrical Machinery Imports
Image
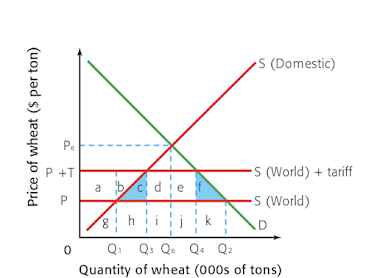
An Increase in Taxes on the Imports of Electrical Machinery and Equipment in Lebanon Starting in May 2019, the imports to Lebanon were subjected to a 2% increase in taxes, and this being a 10% tax on 20 specific imported goods, such as flour, furniture, electric machinery and many more. The reason for increase in taxes for these imports was to, "reduce the trade imbalance, and encourage local production" (HKTDC Research). Specifically, focusing on Electric machinery and equipment, the tariffs for these products the year before were about 3.38% in Lebanon. When thinking about the impact that this increase in taxes might have on the different people in Lebanon, specifically for the domestic producers, they might experience an increase in production. This may mainly be due to there being less imports of Electrical machinery and equipment from other neighboring countries, due to the increased taxes on the products. This will cause domestic producers of Electrical machinery to hav...
Lebanon's Fiscal Policies and Debt

Image
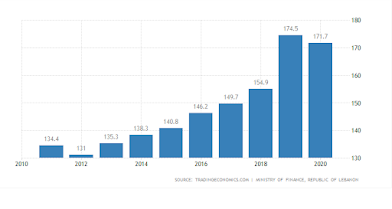
Lebanon has been ongoing a bad financial crisis. The country has been in deep debt for many years all due to decisions the government's made. Lebanon's financial struggles start with the reconstruction that the country needed after the civil war, despite being promised in conferences that they would have some financial assistance with rebuilding, Lebanon still hasn't been able to get back the fiscal stability that they once had beforehand. What also arose because of this crisis were many protests by Lebanese citizens, around the same time in October 2019. The citizens were protesting the list of reforms that the Prime Minister was intending to implement at the time. In terms of their fiscals policies in relation to their ongoing financial crisis, their policies "are producing large-scale debt and inequality", and they've had many issues with their internal fiscal policies as well (Baumann). According to the World Bank, Lebanon's currently experiencing ...

Lebanon: Factors of production!

Image
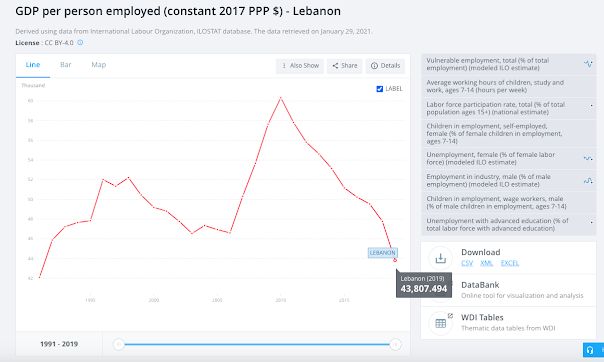
Lebanon: GDP per Person Employed: (Until 2019) Increase in Quantity: Immigration (Until 2015) Net Migration (Until 2021) Improvement in Quality: Education (2018-2019) (2011-2013) Observations:     I wasn't able to observe very much from the data, since a lot of Lebanon's factors of production have either stayed the same for many years or I just couldn't find any data on them. The only types of data on their factors of production I was able to find were on their Immigration, Education, and GDP Per Person Employed (I wasn't able to find their GDP per hour worked anywhere).      As seen in the first picture, Lebanon's GDP per person employed hit its peak at around 2010 to 2011, and began to decline since then until the most recent years (2019). I was also able to find found that their immigration was steadily increasing in quantity from 1995 until 2010. In addition, I also found data and statistics on Lebanon's government expenditure on education (2011 to 2013), bu...

Lebanon: Real GDP Statistics!

Image
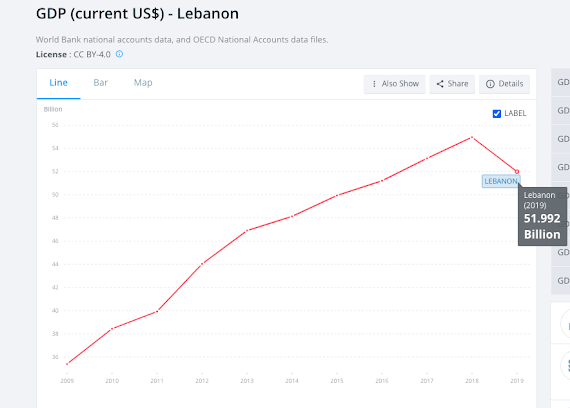
Lebanon's GDP Statistics - OEDC Country Blog Real GDP: $51.992 Billion USD in 2019 Real GDP Per Capita: $7,584 USD in 2019 Real GDP Growth: -6.7% in 2019 Unemployment Rate: 6.61% in 2020 Inflation Rate (Consumer and GDP Deflator): Current Account Balance: -22.2% in 2019 Hidden Economy %: Lebanon's Hidden Economy in 2015 was 29%.     -  Sources:  https://data.worldbank.org/indicator/BN.CAB.XOKA.GD.ZS?end=2019&locations=LB&start=2009 https://data.worldbank.org/indicator/NY.GDP.DEFL.KD.ZG?locations=LB https://data.worldbank.org/indicator/FP.CPI.TOTL.ZG?locations=LB https://data.worldbank.org/indicator/SL.UEM.TOTL.ZS?end=2020&locations=LB&start=2009 https://data.worldbank.org/indicator/NY.GDP.MKTP.KD.ZG?end=2019&locations=LB&start=2009 https://data.worldbank.org/indicator/NY.GDP.PCAP.CD?end=2019&locations=LB&start=2009 https://data.worldbank.org/indicator/NY.GDP.MKTP.CD?end=2019&locations=LB&start=2009     -  Observa...