Posts

Showing posts from April, 2021

Lebanon: Factors of production!
Image
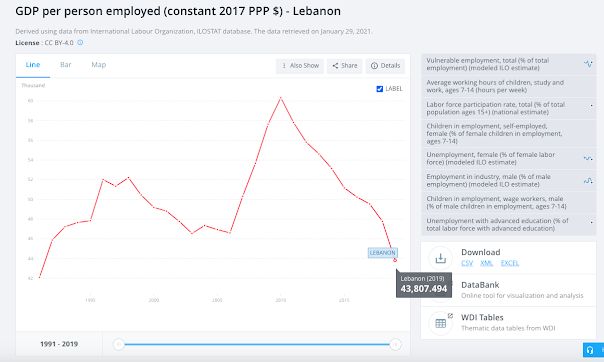
Lebanon: GDP per Person Employed: (Until 2019) Increase in Quantity: Immigration (Until 2015) Net Migration (Until 2021) Improvement in Quality: Education (2018-2019) (2011-2013) Observations:     I wasn't able to observe very much from the data, since a lot of Lebanon's factors of production have either stayed the same for many years or I just couldn't find any data on them. The only types of data on their factors of production I was able to find were on their Immigration, Education, and GDP Per Person Employed (I wasn't able to find their GDP per hour worked anywhere).      As seen in the first picture, Lebanon's GDP per person employed hit its peak at around 2010 to 2011, and began to decline since then until the most recent years (2019). I was also able to find found that their immigration was steadily increasing in quantity from 1995 until 2010. In addition, I also found data and statistics on Lebanon's government expenditure on education (2011 to 2013), bu...
Lebanon: Real GDP Statistics!

Image
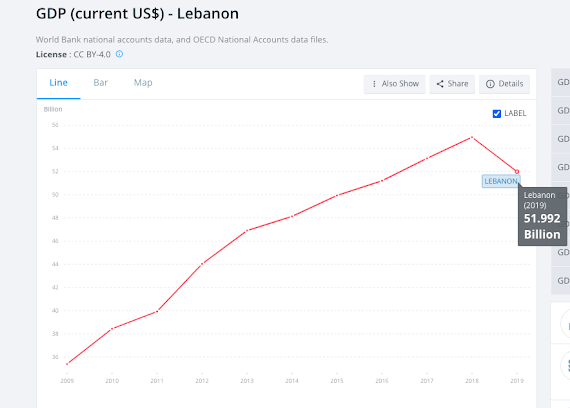
Lebanon's GDP Statistics - OEDC Country Blog Real GDP: $51.992 Billion USD in 2019 Real GDP Per Capita: $7,584 USD in 2019 Real GDP Growth: -6.7% in 2019 Unemployment Rate: 6.61% in 2020 Inflation Rate (Consumer and GDP Deflator): Current Account Balance: -22.2% in 2019 Hidden Economy %: Lebanon's Hidden Economy in 2015 was 29%.     -  Sources:  https://data.worldbank.org/indicator/BN.CAB.XOKA.GD.ZS?end=2019&locations=LB&start=2009 https://data.worldbank.org/indicator/NY.GDP.DEFL.KD.ZG?locations=LB https://data.worldbank.org/indicator/FP.CPI.TOTL.ZG?locations=LB https://data.worldbank.org/indicator/SL.UEM.TOTL.ZS?end=2020&locations=LB&start=2009 https://data.worldbank.org/indicator/NY.GDP.MKTP.KD.ZG?end=2019&locations=LB&start=2009 https://data.worldbank.org/indicator/NY.GDP.PCAP.CD?end=2019&locations=LB&start=2009 https://data.worldbank.org/indicator/NY.GDP.MKTP.CD?end=2019&locations=LB&start=2009     -  Observa...